[2020-11-21] ETFs momentum report
ETF Momentum Report
Top 20 Macro ETFs based on momentum on week ending 2020-11-21
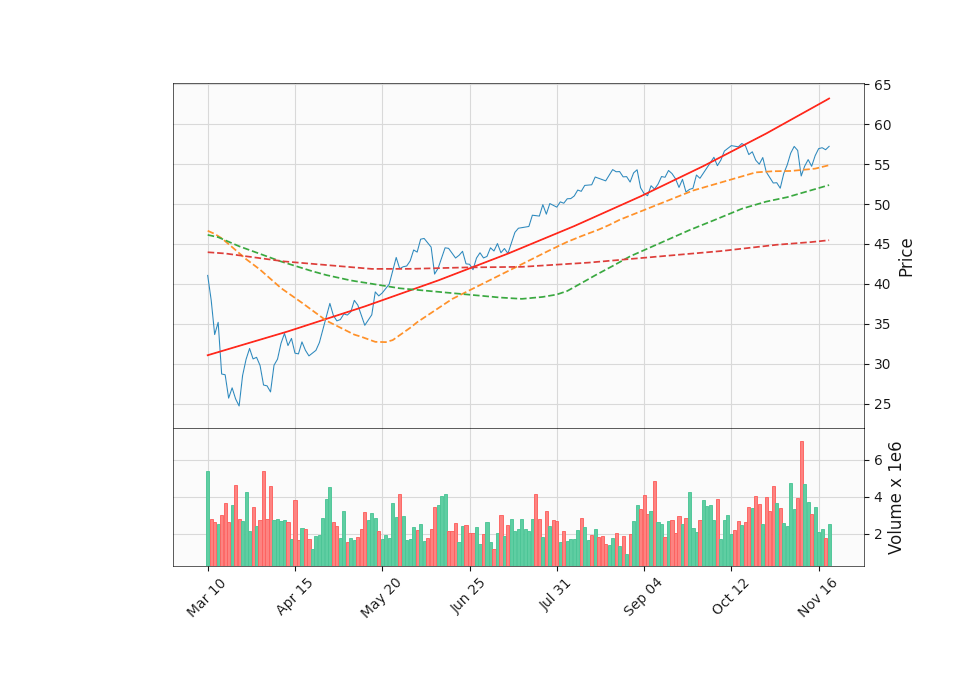
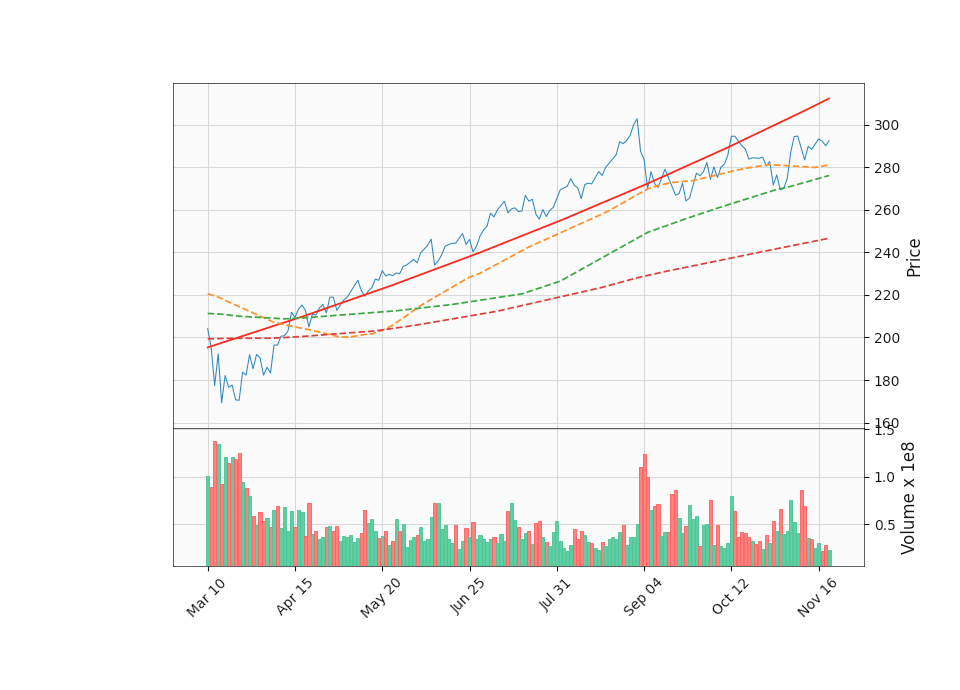
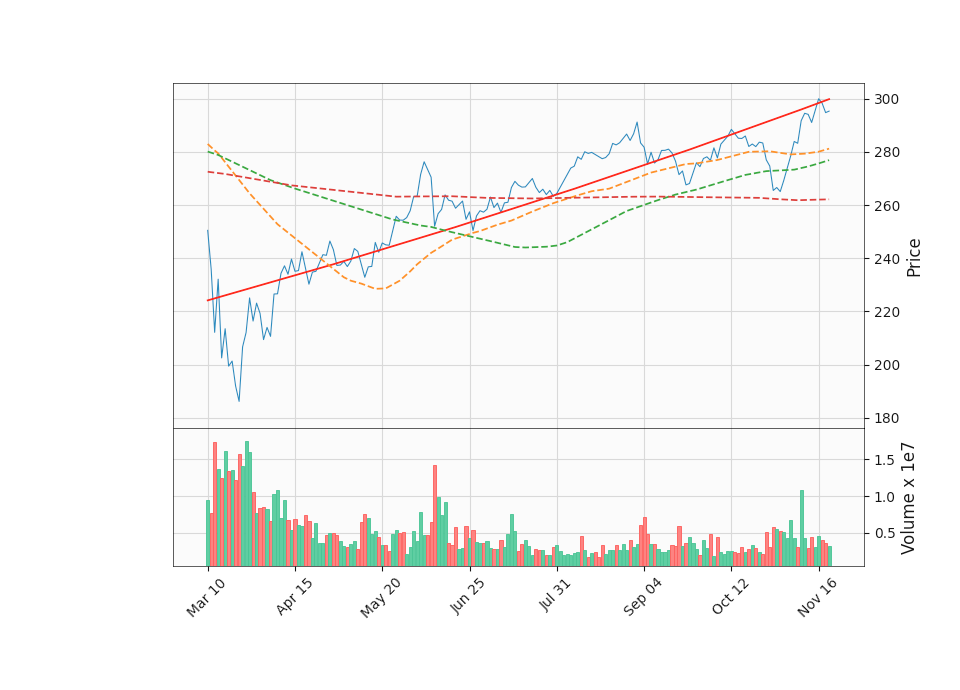
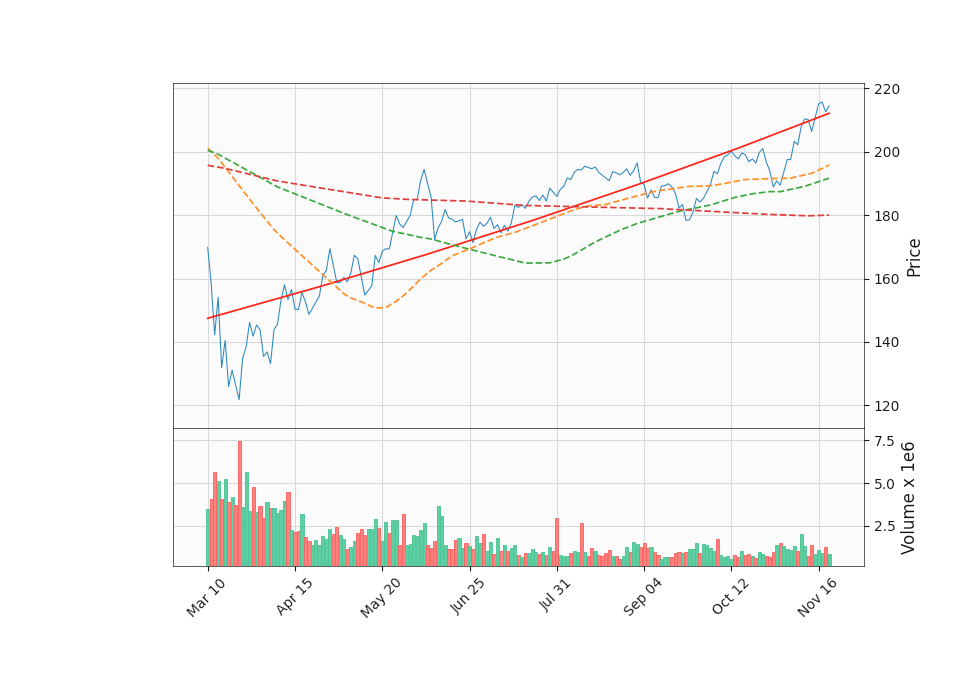
XLI (Industrials)
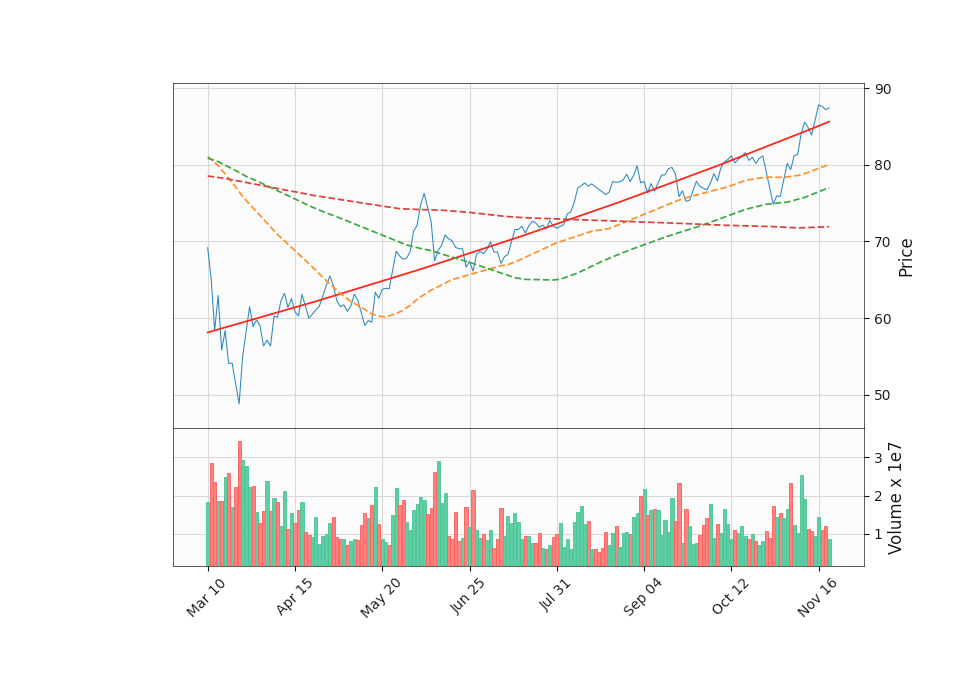
| Metric | Value |
|---|---|
| Momentum | 20.83 |
| 3 Months Gain | 11.04 times |
| Yearly Gain | 1.76 times |
Links:
Y Finance | Y Chart | BarChart | ChartMill | StockInvest | TradingView
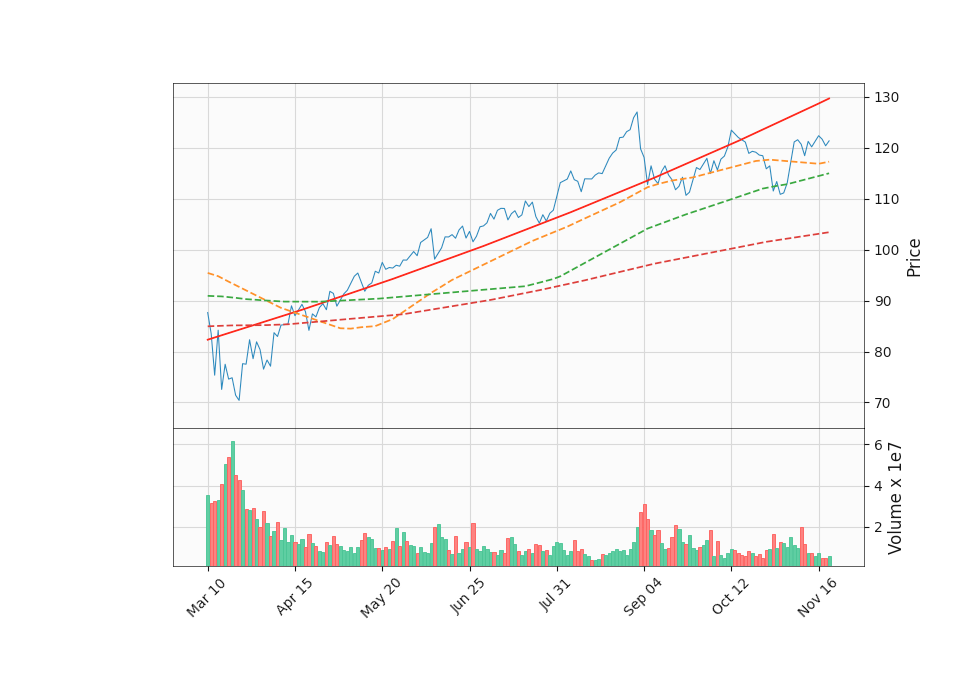
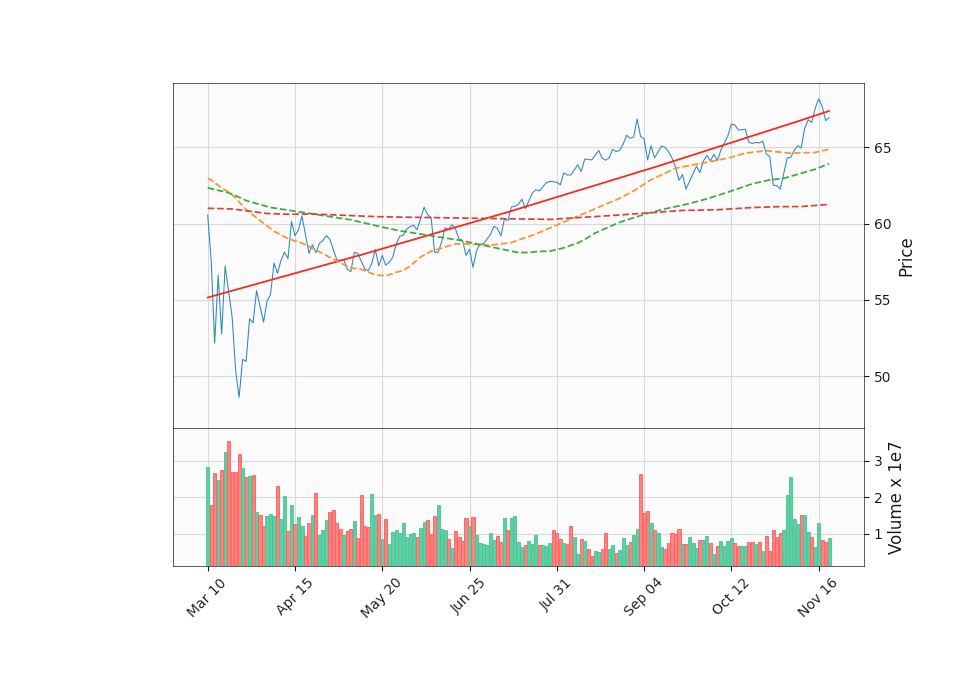
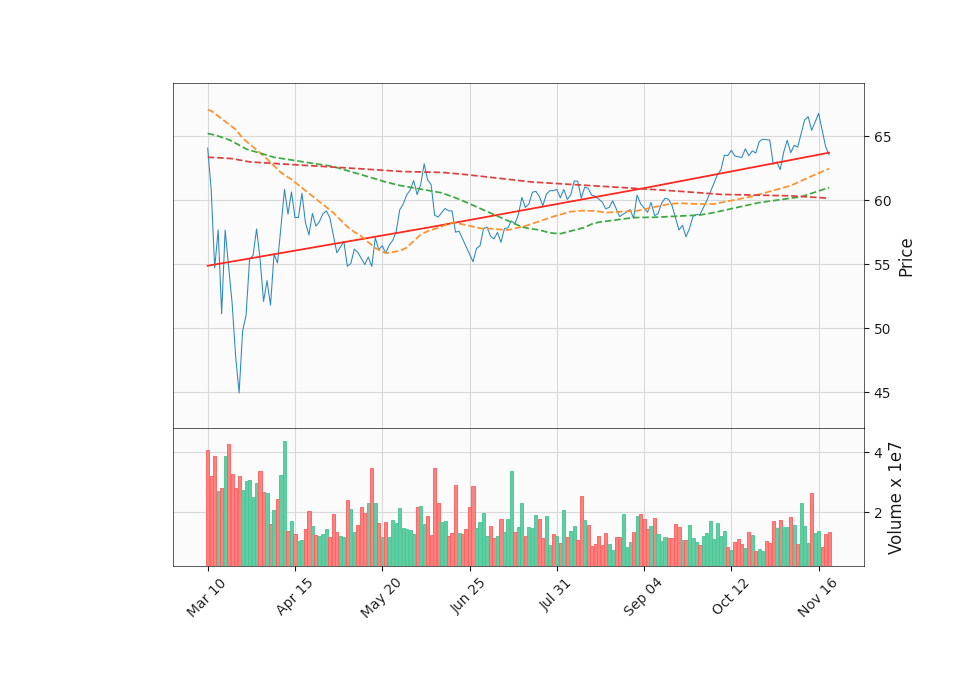
EWJ (Japan)
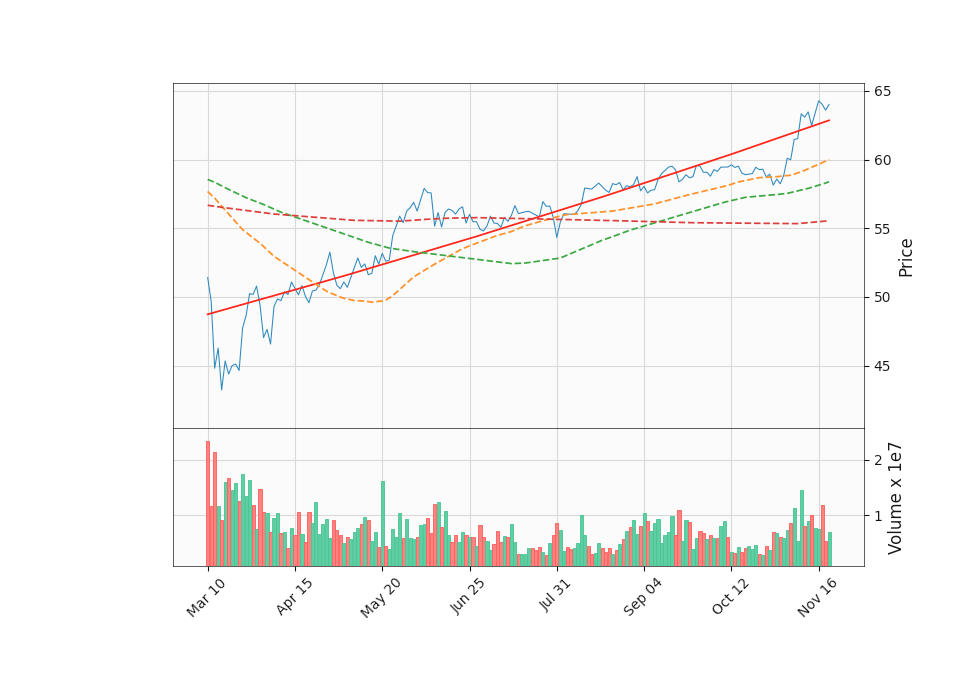
| Metric | Value |
|---|---|
| Momentum | 12.67 |
| 3 Months Gain | 9.54 times |
| Yearly Gain | 1.47 times |
Links:
Y Finance | Y Chart | BarChart | ChartMill | StockInvest | TradingView
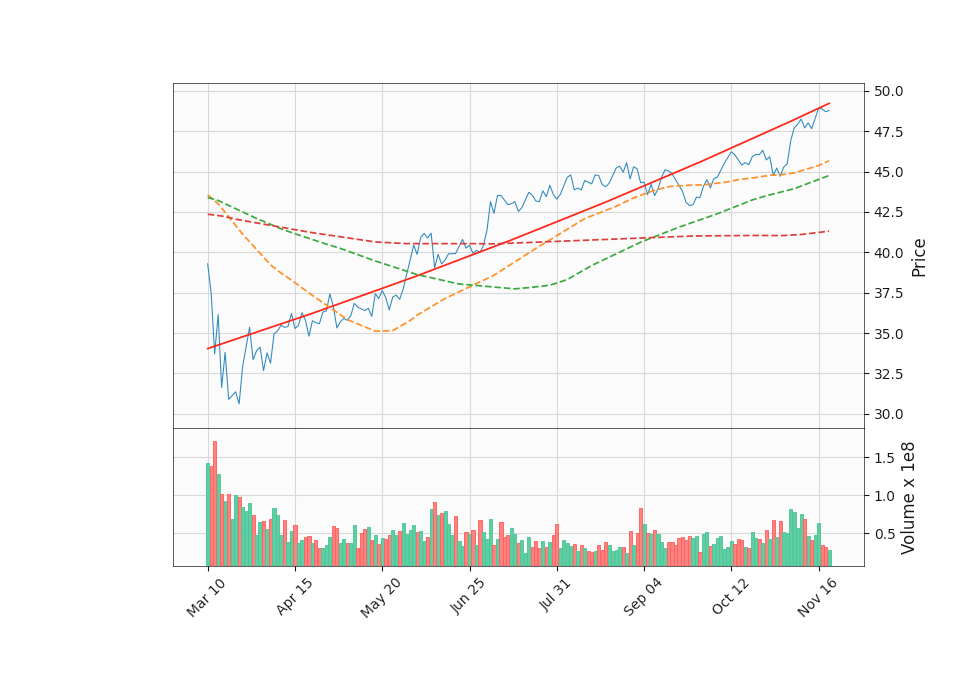
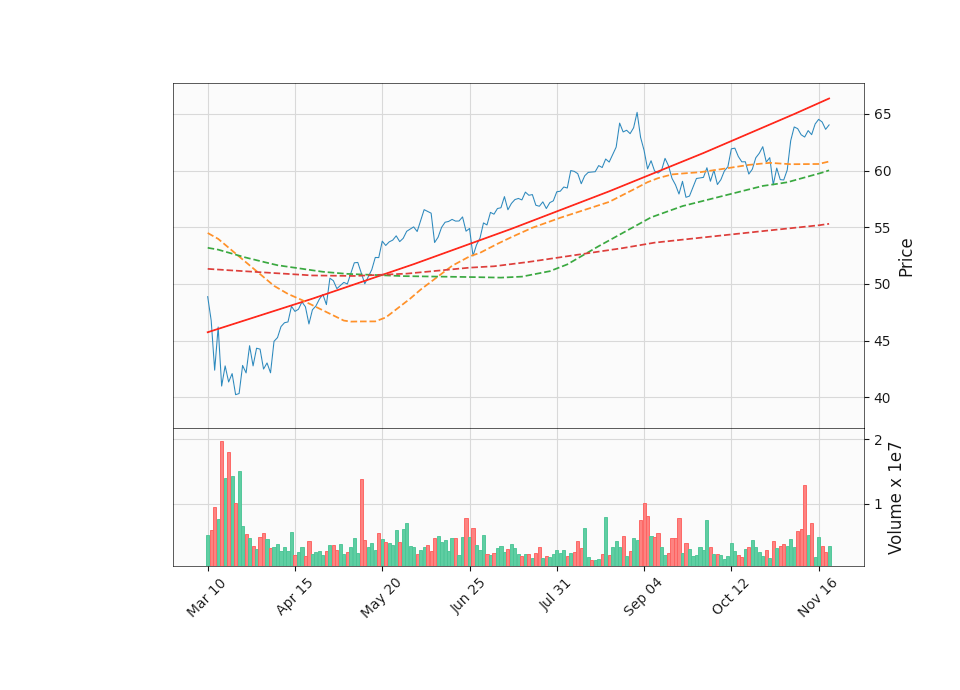
EWY (Korea)
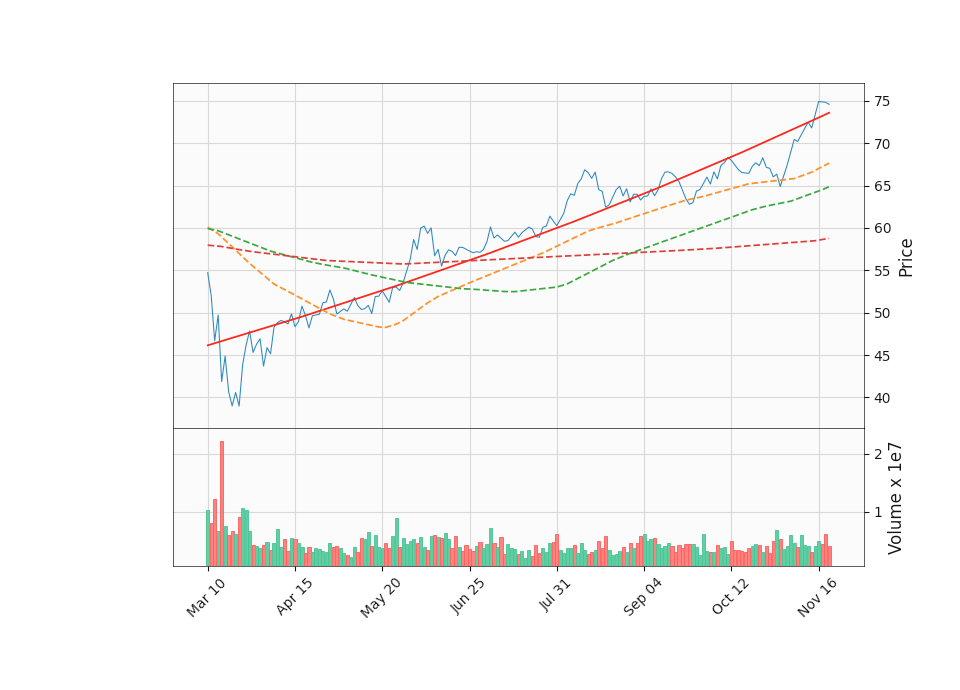
| Metric | Value |
|---|---|
| Momentum | 12.49 |
| 3 Months Gain | 10.54 times |
| Yearly Gain | 1.89 times |
Links:
Y Finance | Y Chart | BarChart | ChartMill | StockInvest | TradingView
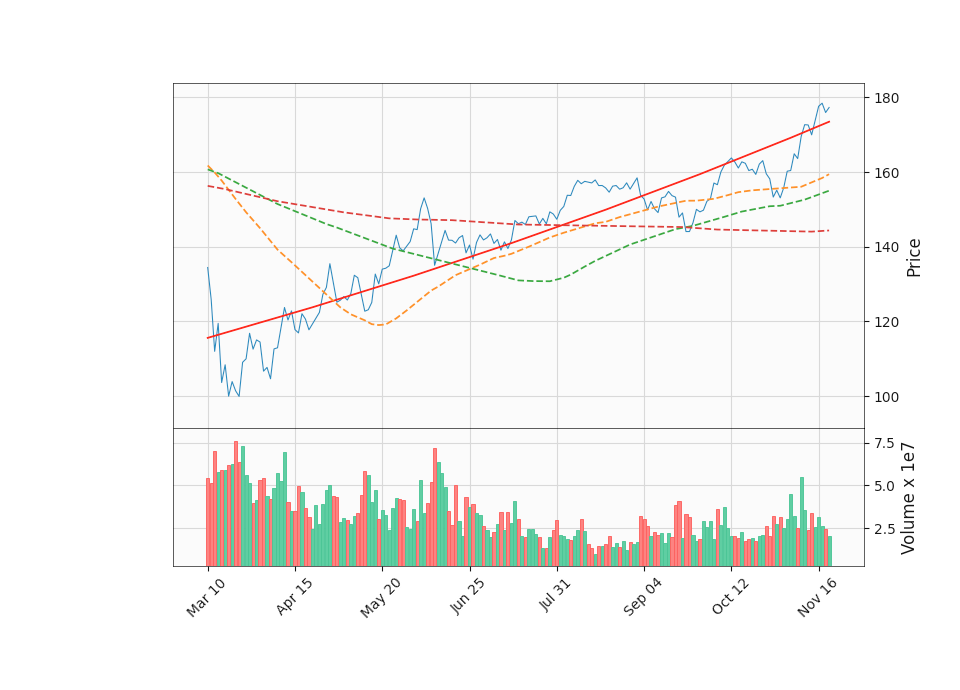
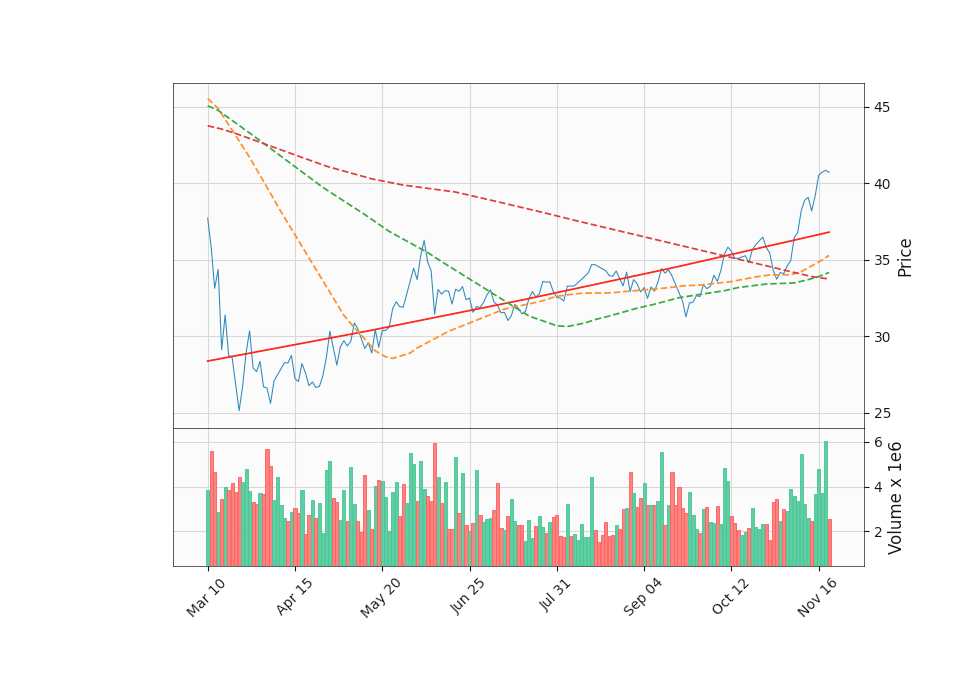
XLB (Basic Materials)
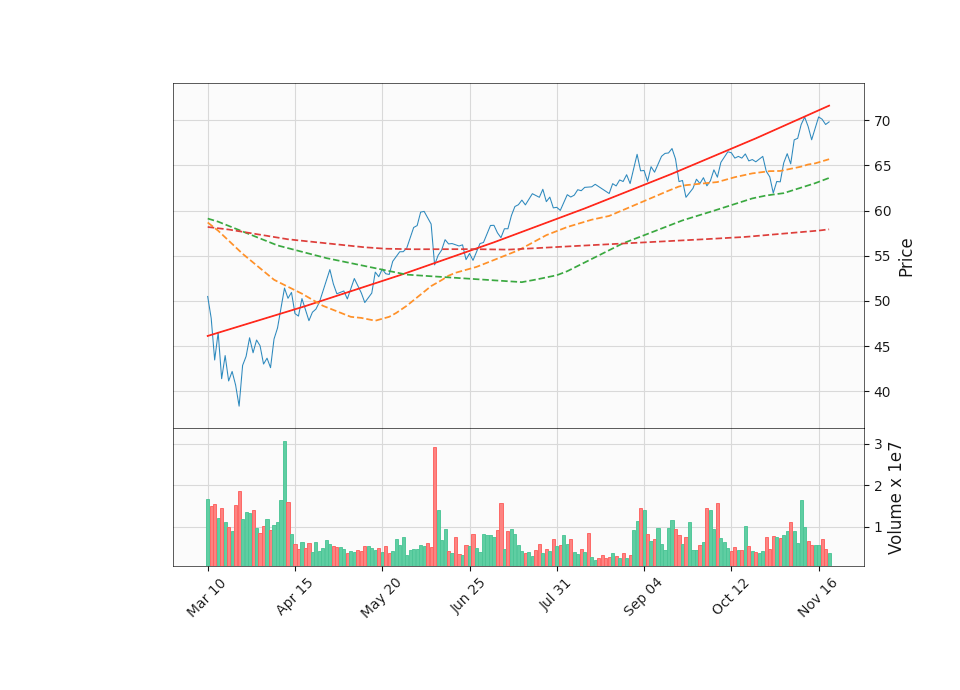
| Metric | Value |
|---|---|
| Momentum | 11.40 |
| 3 Months Gain | 10.31 times |
| Yearly Gain | 1.80 times |
Links:
Y Finance | Y Chart | BarChart | ChartMill | StockInvest | TradingView
XHB (HomeBuilders)
| Metric | Value |
|---|---|
| Momentum | 11.15 |
| 3 Months Gain | 6.95 times |
| Yearly Gain | 2.27 times |
Links:
Y Finance | Y Chart | BarChart | ChartMill | StockInvest | TradingView
SPY (S&P 500 Index)
| Metric | Value |
|---|---|
| Momentum | 8.23 |
| 3 Months Gain | 6.31 times |
| Yearly Gain | 1.61 times |
Links:
Y Finance | Y Chart | BarChart | ChartMill | StockInvest | TradingView
XLY (Consumer Cyclical)
| Metric | Value |
|---|---|
| Momentum | 7.97 |
| 3 Months Gain | 6.86 times |
| Yearly Gain | 1.75 times |
Links:
Y Finance | Y Chart | BarChart | ChartMill | StockInvest | TradingView
XME (Metals and Mining)
| Metric | Value |
|---|---|
| Momentum | 7.69 |
| 3 Months Gain | 12.44 times |
| Yearly Gain | 1.94 times |
Links:
Y Finance | Y Chart | BarChart | ChartMill | StockInvest | TradingView
QQQ (Nasdaq Index)
| Metric | Value |
|---|---|
| Momentum | 7.18 |
| 3 Months Gain | 6.77 times |
| Yearly Gain | 1.72 times |
Links:
Y Finance | Y Chart | BarChart | ChartMill | StockInvest | TradingView
XLK (Technology)
| Metric | Value |
|---|---|
| Momentum | 6.67 |
| 3 Months Gain | 6.35 times |
| Yearly Gain | 1.72 times |
Links:
Y Finance | Y Chart | BarChart | ChartMill | StockInvest | TradingView
EEM (Emerging Markets)
| Metric | Value |
|---|---|
| Momentum | 6.49 |
| 3 Months Gain | 9.05 times |
| Yearly Gain | 1.58 times |
Links:
Y Finance | Y Chart | BarChart | ChartMill | StockInvest | TradingView
IWM (Russell 2000 Index)
| Metric | Value |
|---|---|
| Momentum | 5.96 |
| 3 Months Gain | 10.38 times |
| Yearly Gain | 1.74 times |
Links:
Y Finance | Y Chart | BarChart | ChartMill | StockInvest | TradingView
DIA (Dow Jones Industrials Index)
| Metric | Value |
|---|---|
| Momentum | 4.73 |
| 3 Months Gain | 5.63 times |
| Yearly Gain | 1.59 times |
Links:
Y Finance | Y Chart | BarChart | ChartMill | StockInvest | TradingView
XLC (Communication Services)
| Metric | Value |
|---|---|
| Momentum | 4.71 |
| 3 Months Gain | 7.14 times |
| Yearly Gain | 1.59 times |
Links:
Y Finance | Y Chart | BarChart | ChartMill | StockInvest | TradingView
XLP (Consumer Defensive)
| Metric | Value |
|---|---|
| Momentum | 3.90 |
| 3 Months Gain | 5.24 times |
| Yearly Gain | 1.39 times |
Links:
Y Finance | Y Chart | BarChart | ChartMill | StockInvest | TradingView
EWW (Mexico)
| Metric | Value |
|---|---|
| Momentum | 3.62 |
| 3 Months Gain | 14.73 times |
| Yearly Gain | 1.56 times |
Links:
Y Finance | Y Chart | BarChart | ChartMill | StockInvest | TradingView
IJH (S&P 500 Mid Cap)
| Metric | Value |
|---|---|
| Momentum | 3.51 |
| 3 Months Gain | 8.11 times |
| Yearly Gain | 1.73 times |
Links:
Y Finance | Y Chart | BarChart | ChartMill | StockInvest | TradingView
XLU (Utilities)
| Metric | Value |
|---|---|
| Momentum | 3.20 |
| 3 Months Gain | 8.50 times |
| Yearly Gain | 1.47 times |
Links:
Y Finance | Y Chart | BarChart | ChartMill | StockInvest | TradingView
DBA (Agriculture)
| Metric | Value |
|---|---|
| Momentum | 2.89 |
| 3 Months Gain | 5.18 times |
| Yearly Gain | 1.14 times |
Links:
Y Finance | Y Chart | BarChart | ChartMill | StockInvest | TradingView
FXI (China)
| Metric | Value |
|---|---|
| Momentum | 2.72 |
| 3 Months Gain | 10.89 times |
| Yearly Gain | 1.40 times |
Links:
Y Finance | Y Chart | BarChart | ChartMill | StockInvest | TradingView